Digital Mappings
Keith D Lilley
Figure 1. Extract of William Smith’s (1588) plan of Chester from his “The Particuler Description of England. With the portratures of certaine of the cheiffest citties & townes” (Source: British Library, Harley MS 1046, fol. 173).
Introduction
No medieval maps of Chester are known to have existed. This is not unusual. Instead, the earliest cartography to show the city’s local topography and landscape dates from the end of the sixteenth century, comparatively early by English standards but not early enough to be a medieval map of Chester (Fig. 1). 1 For those mapping medieval Chester, there is, then, no contemporary exemplar to use to depict what the city was like in the Middle Ages. Most modern commentators have relied upon adapting modern street maps to mark on medieval street-names, along with (usually) the city’s walls, the locations of its gates, monastic houses, parish churches, civic buildings, as well as key landmarks, such as the bridge across the Dee, and Chester’s distinctive and particular contribution to medieval architecture, the Rows. Such urban mappings often feature in historical work on the city, as well as in archaeological studies, most typically prefacing an article or book simply as an illustrative device to show the relative positions of the city’s medieval institutions – whether civic, military or religious – and the framework of streets that interconnected them. 2
Maps can also be used for more analytical purposes, in understanding a city’s spatial evolution, while the process of mapping – as an artistic and creative exercise – can open our historical and geographical imaginations to help us to understand a place better. 3 In ‘Mapping Medieval Chester’, the use of maps and mapping sought to achieve both; to move away from simply using maps as a means of illustration. Doing so poses certain methodological problems, however, for without medieval maps of the city how is it possible to begin to map its medieval urban landscape? The answer is to use the maps that are available, even though they are post-medieval in date, and from them, along with available archaeological and historical evidence piece together, piece together the physical and topographical features that comprised Chester at some period or moment in its past. 4 This approach thus makes use of cartographic sources and techniques to create new maps of medieval urban landscapes. 5 In the case of Chester, the existence of early modern and later maps, coupled with an established and well-documented archaeological record, makes this task somewhat easier here than for some other English medieval towns and cities.
Historic maps and Chester’s medieval urban topography
A succession of maps and plans of Chester, from Smith’s late-sixteenth century manuscript plan through to detailed Ordnance Survey (OS) mapping of the mid- to late-nineteenth century, provides a sequence of geographical and temporal ‘snapshots’ charting the changes taking place in its local landscape as the city’s medieval urban antecedents were gradually transformed into an expanded and industrialised city of the 1800s. Of these map-sources, the large-scale OS 1:500 scale plans of 1871-73 are without doubt the most accurately drawn and surveyed, showing in great detail the urban landscape of Victorian Chester, including individual buildings and their respective property boundaries (Fig. 2).
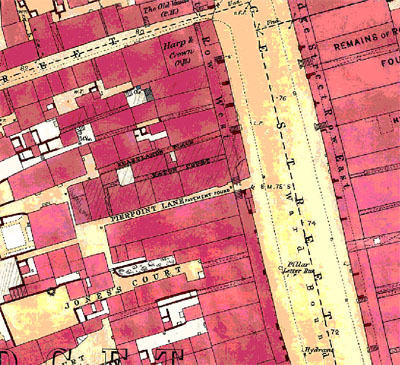
Figure 2. Extract from OS 1:500 scale plan of Chester (1871-73), showing part of Bridge Street and its associated plot-patterns stretching along both street-frontages, with buildings individually and separately identified (coloured pink in the original) (Source: Chester Record Office / ’The Digital Mapper’)
Of course, chronologically, these modern OS maps are – at first glance – far removed from the medieval city, yet the urban landscape that they show actually has within it the fossilized remains of Chester’s medieval ancestry. Thus many of the streets surveyed in such detail by the OS in the 1870s, especially those within the city’s walls, owe their layout to the Middle Ages when most were first created, some at least dating from the ninth century, if not earlier. 6 Similarly the plot-boundaries, city walls and gates, ecclesiastical buildings, and other topographical features recorded by the Ordnance Surveyors, and shown on their detailed plans, are also largely inherited from the Middle Ages, making these plans a valuable cartographic source from which to begin mapping Chester’s late medieval urban landscape.
Over the intervening period of some three hundred years, certain areas and features of late-medieval Chester clearly had disappeared from its landscape. These are made apparent simply by comparing the OS plans and Smith’s plan of the city of 1588. A number of intervening historic maps and plans, such as the one drawn by Alexander de Lavaux in 1745, chart these gradual erasures from the landscape, and their replacement by successive modern structures and townscapes, but the city’s enduring medieval skeleton remains visible, at least partially, in these later (re)mappings. Where Chester’s medieval features were more successfully obliterated, notably after the Reformation in the case of monastic houses, the work of local archaeologists over the past half a century has done much to help locate them and to map the boundaries of former monastic precincts, for example, and establish the ground-plans for their conventual buildings. 7 The same is true for certain other urban features too, including urban properties situated in the commercial heart of the city, proving again the longevity in many cases of the street and plot patterns that are shown by the OS 1:500 plans. 8 An underlying medieval urban landscape was therefore inadvertently represented by modern surveyors in their maps of Chester, as is borne out by archaeological findings.
Archaeology, together with the sequence of historic maps of Chester, thus provides a firm starting point for mapping out the late-medieval city’s urban topography, and attempting to create a map of Chester c.1500 that is accurate and detailed, both geographically and historically, in what it shows. This mapping exercise was undertaken using ‘spatial technologies’ suited to creating digital maps, a process that involved combining cartographic, historical and archaeological information in a Geographical Information System (GIS). This technique of mapping out medieval Chester – and the insights this offers us – is considered next.
Creating a digital map of late-medieval Chester using GIS
One of Mapping Medieval Chester’s main aims was to create a cartographically accurate and historically valid digital map of the city’s urban landscape as it was at around 1500, partly as a foil to those textual urban ‘mappings’ offered by medieval contemporaries such as Lucian and Bradshaw (see above), and partly to make available – via a web-resource – an interactive map of the late-medieval city that would link with these texts and offer users different (textual and visual) means of navigating and negotiating the spaces and places, landscapes and localities, of late-medieval Chester. The ‘spatial technologies’ used to create this digital map are well-known to cartographers and surveyors working in geology, planning, archaeology and geography, but are comparatively new to medievalists and urban historians. 9 Their application to map medieval Chester therefore demands some explanation, and following this, some reflection, conceptually and theoretically, on what they can reveal of the medieval city, and how our digital urban mappings relate to the textual mappings of Chester’s medieval contemporaries.
Creating a map of late-medieval Chester could have been done using traditional methods of draughting using tracing overlays and selectively drawing out certain urban features to show in a final finished paper map. A Geographical Information System (GIS) offers a means of performing the same process, but within a digital medium there are distinct advantages that are not easily replicated using tracings and paper. This is because a GIS is, foremost, a database for storing, retrieving and analysing spatial data, which includes maps of course, and enables users to keep track of different data and its sources. 10 It also provides a means of converting analogue maps into digital data (through a process of digitization), and allows maps to be quickly and easily generated from these data, either in a digital or a paper format. Tracking data sources is particularly useful in historical mapping where it is necessary to offer transparency in the map-making process, for as we shall see, decisions on what to include and exclude are fundamental to trying to map out medieval urban landscapes, simply because the available evidence is so fragmentary.
Re-assembling a medieval city’s physical layout requires a process of piecing together a map from many sources, some cartographic, others archaeological and documentary. In some cases, as with the map-evidence, these sources are not contemporary with the Middle Ages, while in other cases they are, as with excavated remains of buildings resulting from archaeological work. Moreover, with archaeological and documentary sources the evidence is good for some areas of a city but poorer or non-existent in others – Chester is typical in this regard – which presents a problem when it comes to trying to map the whole city, for clearly it is undesirable to have blank areas reflecting a current lack of knowledge rather than any lack of medieval occupation. Yet such terrae incognita still need to be represented on a map, and using GIS not only makes it possible to include them (using later map evidence and a degree of conjecture) but to alert users of the map about where the evidence was taken from and which sources were used to create it. This degree of ‘cartographic transparency’ is difficult to achieve using paper maps, but easily resolved using GIS to re-assemble the medieval urban landscape. How, then, is this done?
Within a GIS a series of map layers are built up by importing digital scans (‘rasters’) of paper maps, such as Chester’s historic town-plans discussed earlier. The plans used in the Chester GIS included the OS 1:500 plans, as well as Lavaux’s 1745 plan, and others from the late 1500s to mid-1800s. These rasters are used as the basis for digitization, of creating digital spatial data from them, selectively. In the GIS they each appear as a separate ‘layer’ that can be then ‘geo-rectified’, that is, placed in a modern geographical co-ordinate system. This geo-rectifying works much better for more modern maps than it does for early historic maps, since the latter were usually surveyed and drawn using projection systems that do not translate easily into modern geographical (ie. latitude and longitude) co-ordinate systems that are used by GIS software (eg. ArcGIS). This again presents a methodological problem, described below, but in theory at least these historic maps should all sit one above the other, the layers themselves equivalent to urban topographic ‘strata’ of particular periods or dates (Fig. 3).
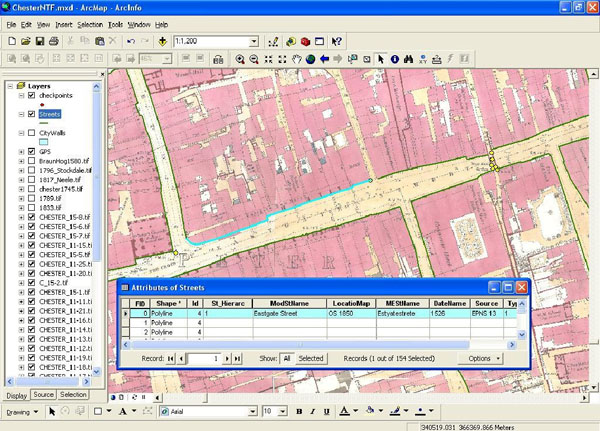
Figure 3. Screen dump from the Chester project GIS in its developmental stage showing historic map layers (‘rasters’, in the list, left) and the digitizing of features underway (seen in the map window; right), in this case Eastgate Street being digitized from the OS 1:500 plan, together with an example of the associated ‘attribute data’ (for Eastgate Street, with information about it held on the database).
Of the historic maps used in this exercise, the OS 1:500 1870s plans geo-rectified to modern geographical co-ordinates with least difficulty. This was proven by incorporating into the GIS field-survey data gathered using a differential Global Positioning System (dGPS). Using dGPS in such urban surveys is described in detail elsewhere. 11 For Chester key topographical features and locations were surveyed (in September 2008, by Keith Lilley and Lorraine Barry), establishing their precise geographical positions. This positional data is then imported into the GIS and from it the degrees of ‘distortion’ in the various historic cartographic layers established and quantified (using tools in the GIS). What this exercise showed for the Chester historic maps was the high degree of accuracy achieved by the Ordnance Survey in its 1:500 plans, and also to some extent too by Alexander de Lavaux in the 1740s. But beyond these particular two map sources cartographic accuracy – in the modern sense – was lacking, making it difficult (and to some extent pointless) to try to geo-rectify these other maps within the GIS. Since the OS 1:500 plans are cartographically most accurate, and also (as noted earlier) historically useful as repositories of relict urban features dating from the Middle Ages, they were the principal cartographic source used to map out late medieval Chester, despite their later date.
With the historic map layers imported into the GIS, the next main stage in the mapping process requires selectively digitizing those urban features of medieval antecedence, which in Chester’s case began by using the OS 1:500 plans. This procedure is carried out ‘on screen’ using tools in the GIS software. Which particular urban features were to be selected and digitized? Here decisions had to be made based upon the available historical evidence: for example, which of the streets shown on the OS plans are known (from documentary sources and archaeology) to have existed in 1500? What post-medieval changes have taken place to affect their alignment and orientation?
The same questions relate to other urban features too: could the alignments of the city’s walls, the locations and ground-plans of parish churches and the abbey, the plot-patterns, Rows, and narrow lanes, all shown by the 1:500 plans, also be relied upon both historically and geographically to be those present in 1500? Such questioning of the map evidence is vital if the finished map is to be believed and trusted. Here the transparency that GIS offers is useful, for it allows the map’s creators (and later its users) to see exactly where the mapped topographical information comes from, for not only are features being digitized in the GIS, each vector – digitized line, polygon or point – can also be described and annotated using ‘attribute data’ (see Fig. 3). Each digitized feature (a street or building, for example) has its own unique identification number which links it to an entry on a database in the GIS on which information about the feature is stored. This information includes, for example, which map source the feature was digitized from, and what the documentary or archaeological evidence is to establish its medieval provenance.
Using Chester’s earliest maps, together with existing historical and archaeological knowledge of the medieval city, the OS 1:500 plans were digitized in stages, starting with the street patterns for the city as a whole, and proceeding through other constituent urban topographical features, such as the circuit of city walls, other standing medieval structures, such as churches, gates and towers on the walls, plot-patterns along the medieval streets, the Rows, the bridge over the Dee, and the course of the Dee itself, all shown by the OS 1:500 plans. Each of these features was digitized as a separate layer in the GIS, partly because one aim was to be able to re-present them in the final web-resource in a way that allows users to selectively turn each of them either on or off, as needed, and partly because making each of the layers – each of the topographic features – independent allows them to be depicted visually differently in the GIS in terms of line-weighting, colour, shade and so forth, which helps to communicate more effectively the different cartographic information contained in the GIS (Fig. 4).
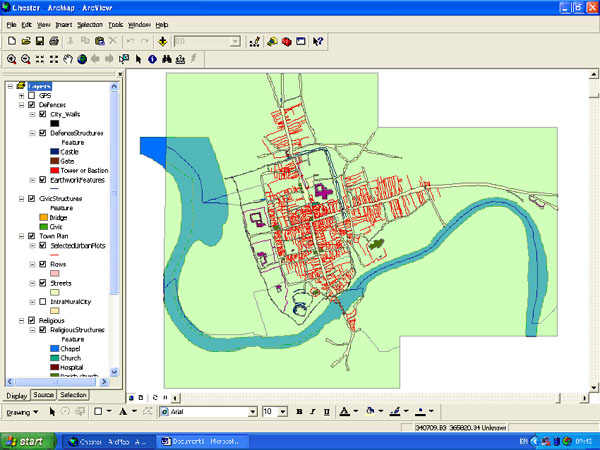
Figure 4. Screen dump from the Chester project GIS showing topographic layers (left) and digitized features in the map window (right). This is the GIS in its final stages with the map showing the city’s topography and layout c.1500.
Much of the digitizing of Chester’s medieval urban topography thus relied upon the form and position of selected features taken from the OS 1:500 plans. However, with the changes that had taken place in the city since 1500 certain features were either missing completely from the OS plans or were substantially altered. To insert them onto the digital map meant sourcing them from elsewhere. Here again GIS offers particular advantages. The ‘holes’ or gaps in our emerging map of late-medieval Chester were made abundantly clear in the GIS if the raster layers (ie. historic map scans) were momentarily turned off, particularly in those areas along the western side of the city, just within the walls, where the majority of the city’s religious houses had stood (as well as the castle, which survives today, albeit much altered). To map these ‘lost’ features relied primarily upon scanning archaeological plans, kindly made available by the city archaeologist, Simon Ward. Over a period of thirty or more years, excavations of Chester’s medieval past have advanced greatly, compensating for the decades of neglect by earlier generations of archaeologists who had mostly just dug through medieval occupation layers to focus on the city’s Roman archaeology.
With the scanned archaeological plans of excavated and surveyed features imported into the GIS, and geo-rectified to the OS 1:500 layer, it is then a straightforward process to digitize selectively from them the outlines of former medieval structures, such as the city’s lost religious houses and their precincts, the course of the ditch outside the city walls; and the size and ground-plans of churches and chapels, as well as the medieval extent of the castle and the Rows, as they were before being variously ‘restored’, or truncated, in more recent times. The dual advantage of using these archaeological plans is that they are drawn to modern cartographic standards, and so easily geo-rectified, yet also reveal how these urban structures and features formerly appeared, at the end of the Middle Ages, in the period our digital map aims to show (see Fig. 4). This still leaves significant gaps in the digital map, however, especially in cases where redevelopment had changed the alignment of a street, or had removed some former plot boundaries, or obliterated known medieval buildings, including the city’s gates and the structures that had stood in the market place in front of the abbey gate.
In some cases, the locations and shapes of these missing medieval urban features are shown by certain of the city’s historic town-plans, but digitizing from these is not straightforward since they geo-rectified comparatively poorly, and generally lacked the level of topographical detail offered by the OS 1:500 plans and the archaeological surveys already used. The need to include these lost, but documented medieval features of late-medieval Chester, required a pragmatic approach, of using these earlier map-sources selectively, as a guide, sometimes by ‘locally’ geo-rectifying a part of the map to relocate a lost feature (which generally worked better than trying to geo-rectify the whole of map), or sometimes simply by redrawing the lost feature (in the GIS) and locating it not exactly where the historic map showed it to be but where it seemed historically and topographically to belong. The latter process was used, for example, to position and delimit the demolished market hall, as well as some of the city’s former medieval gates (their positions clearly relating to the alignments of the walls, even if the locally-geo-rectified historic maps had placed them in some other position nearby); while the former method was used to help recreate the earlier alignments of once narrow streets that were widened and ‘improved’ in the eighteenth and nineteenth centuries, as well as add in streets that had altogether disappeared, as in the case of Capel Lane near Bridge Gate, and part of Castle Street (Fig. 5). Again, as with the other digitized features, the sources and problems associated with locating and mapping these lost features can be documented through the use of the linked attribute tables, as well as by using the ‘symbology’ available in the GIS software to give different layers and features different visual appearances from those more historically and geographically ‘secure’ mapped features gained by digitizing from the OS 1:500 and archaeological plans.
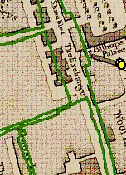
Figure 5. Examples of overlaying different geo-rectified historic map layers to establish earlier urban topographies: left, streets digitized from the OS 1:500 plans overlaid on Lavaux’s 1745 plan; right, OS 1:500 plan of 1872-3 overlaid onto earlier (1780s) map in the area of Castle Street and Bridge Street, and clearly showing up the diagonal line of the new Grosvenor Street inserted in the early 1830s cutting through earlier street and plot-patterns.
Chester’s medieval townscape in digital form
What results from this digital mapping process, then, is a flexible and interactive map-resource that aims to re-assemble fragments of Chester’s medieval townscape from different sources and to map them out according to modern geographical co-ordinates and cartographic conventions, allowing transparency in the map-making process and also making possible both digital and analogue (paper) outputs for further study or dissemination. This transparency reveals the delicate nature of this sort of historical urban mapping exercise, and it helps to undermine and query a map’s (otherwise assumed) authority through providing others with the opportunity to put forward alternative mappings, either by adding new information that arises or using existing information to offer different interpretations.
This exercise in mapping late-medieval Chester has also helped the project team to reflect on how medieval townscape is experienced and understood through modern maps and map-making, and how this differs through engaging with ‘textual’ mappings recorded by those contemporaries who experienced and knew the city first-hand. Trying to connect these modern and medieval ‘urban mappings’ raises some interesting issues as we had hoped: for example, these two mappings – the textual and visual – the alliterative and literal - the medieval and modern – do not easily correspond to each other, even though ostensibly they concern the same local urban topographies. We hope that having these differing and contrasting mappings of medieval Chester inspires further reflection on the complexities of urban spaces.
Footnotes
- 1.
- For a list of printed maps and plans for Chester see Anon., 2001. Back to context...
- 2.
- A case in point is Laughton, 2008, where the street map appears opposite the title page. Another similar example appears in Brown, 1999, 5. Back to context...
- 3.
- See Lilley, 2000. Back to context...
- 4.
- On the principles of this approach see Lilley, 2000. Back to context...
- 5.
- Eg. Keith D. Lilley, Christopher D. Lloyd and Steven Trick, Mapping Medieval Townscapes: a digital atlas of the new towns of Edward I, accessible here. Back to context...
- 6.
- See Alldridge, 1981-83. Back to context...
- 7.
- Ward, 1990. Back to context...
- 8.
- Matthews, 1995. Back to context...
- 9.
- See Wheatley and Gillings, 2002, Gregory and Ell, 2007. Back to context...
- 10.
- See Longley, Goodchild, Maguire and Rhind, 2005. Back to context...
- 11.
- Lilley, Lloyd, Trick and Graham, 2005. Back to context...